Shaking Layers
What is Shaking Layers?
The Shaking Layers tool produces maps of ground shaking following an earthquake. These maps combine strong motion measurements recorded at seismic stations with ground motion modelling to estimate shaking intensity anywhere in the country. As more data and scientific information become available, shaking layers maps are updated and therefore can change over time (from minutes to days to months) following an earthquake.
This short video explains how to navigate the maps to get a measure of how strong the shaking was in any area following a magnitude 3.5 or greater earthquake.
Map Layers
There are several layers that can be viewed on a shaking map that help to determine the intensity of the shaking. An MMI Intensity Heatmap (figure 1) represents the ground shaking with an opaque-coloured overlay. Contoured maps are produced with lines of different colours indicating intensity (figure 2), peak ground acceleration (PGA), and peak ground velocity (PGV). Shaking Layers also produces maps that show stations (figure 3) coloured with their recorded intensities.
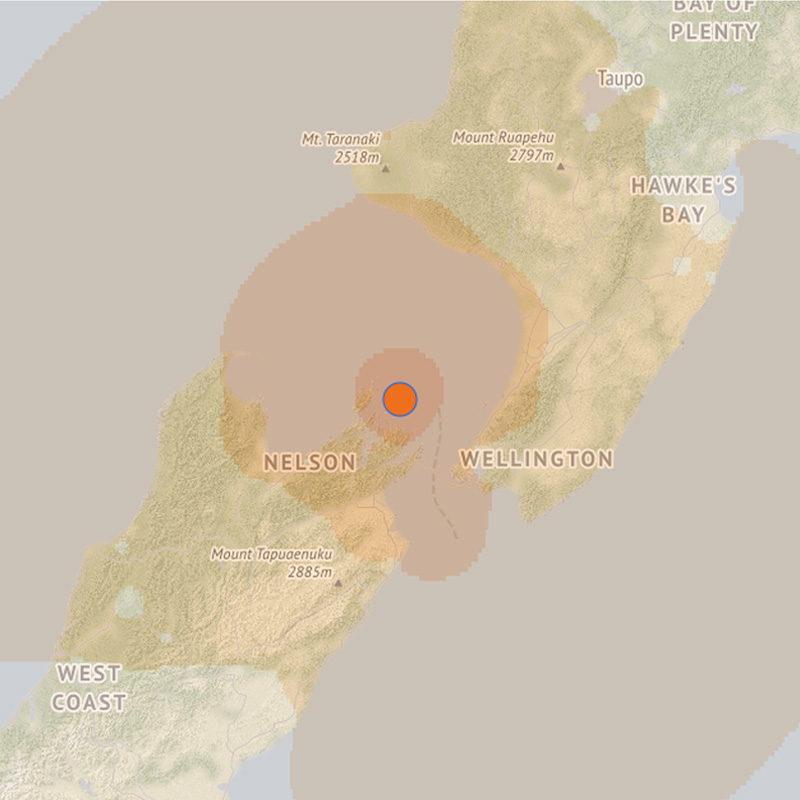
Figure 1: MMI Intensity Heatmap of magnitude 5.8 earthquake in the Cook Strait.
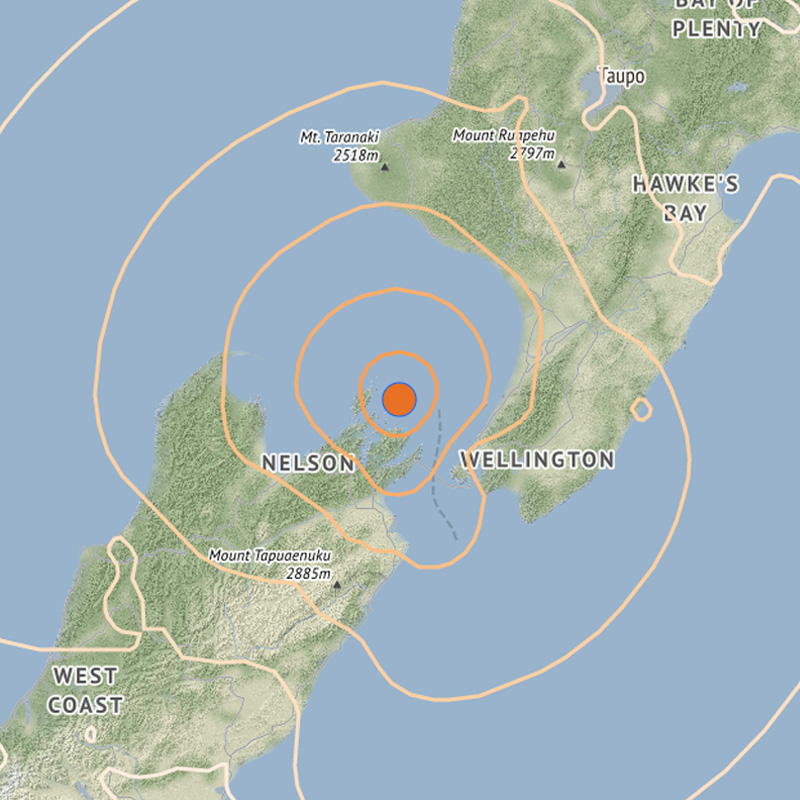
Figure 2: MMI Intensity Contours of magnitude 5.8 earthquake in the Cook Strait.
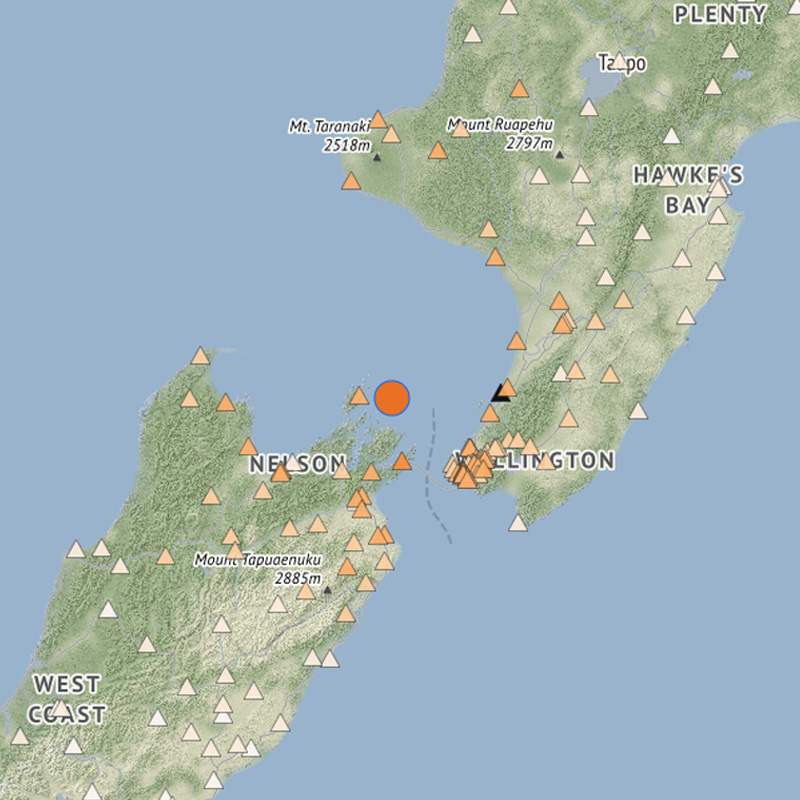
Figure 3: Recorded Stations Intensity of magnitude 5.8 earthquake in the Cook Strait.
About Shaking Layers Maps
Maps may evolve significantly through time, particularly when a large earthquake occurs. For these earthquakes, GNS Science seismologists use the latest earthquake science to improve shaking layers models. This means the latest map reviewed by a seismologist may look different from the first automatically generated maps. Generally earthquakes less than magnitude 5.5 will not be be updated by seismologists from the automatic version unless it is of significant interest.
The first, automated shaking map for an earthquake event takes several minutes to be produced. Because of New Zealand's complicated seismic landscape, our system needs to first determine if a Shaking Layers map is created for an earthquake recorded by our sensors. If the earthquake meets the parameters for Shaking Layers map creation, the automatic process will begin. It may take up to 20 minutes for the first map to be created, during this time we will display a "system is processing” message. The first map will be displayed when it has been created and the event page is refreshed in the web browser. All subsequent maps will be loaded automatically when the event page is refreshed in the web browser. If no map is created after 30 minutes, we will display a “Shaking Layers map has not been generated” message.
The Earthquake Experts Panel (EEP) can also manually create a Shaking Layers map for any significant earthquake where the automatic system has not produced a Shaking Layers map.
How Shaking Layers Works
Shaking Layers produces a map automatically within about 20 minutes of when GeoNet’s earthquake location systems detect an earthquake of magnitude 3.5 or higher. The automatic maps use basic earthquake parameters (magnitude, epicentre, and depth) and recorded strong motion data combined with ground motion models to estimate shaking.
GNS seismologists can include new and more sophisticated earthquake information, rupture models or 'felt reports' submitted by the public to improve shaking layers maps. This is a key capability, which allows new shaking layers maps to be generated that reflect our best scientific understanding at the time. Particularly in large complex earthquakes such as the 2016 magnitude 7.8 Kaikōura earthquake, scientific models may continue to evolve significantly from the first minutes to hours to days and even months after the event.
Collaborators / Partnerships
Science is a collaborative effort; Shaking Layers is a GNS Science product supported by GeoNet and the Rapid Characterisation of Earthquakes and Tsunami (R-CET) programme.
Shaking Layers Project leadership includes cross-programme scientific and technical leaders, and the project runs both scientific advisory and end-user advisory panels to support decision-making.
Helpful Links
Download Shaking Layers event data
If you are interested in downloading event data, visit the Shaking Layers data website.
API - Shaking Layers
Use the Shaking Layers API to automatically update your program with the latest run files for an event.